
What You Should Actually Pay for Responsive Web Design Today
What Responsive Web Design Costs in 2026
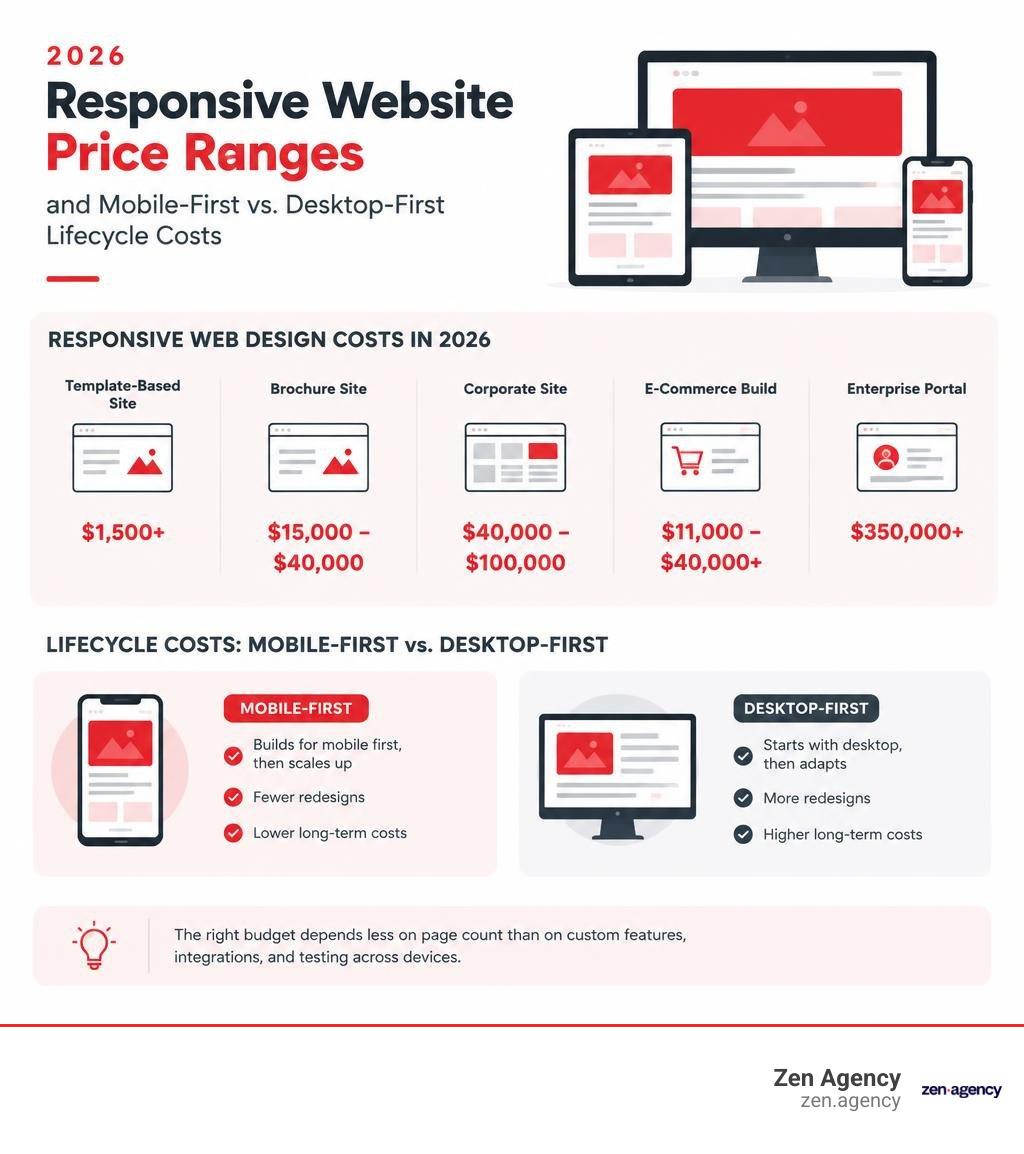
Responsive web design cost in 2026 ranges from about $1,500 for a basic template-based site to $350,000 or more for an enterprise portal. A custom brochure site typically costs $15,000-$40,000, a corporate site $40,000-$100,000, and an e-commerce build roughly $11,000-$40,000 or more. The right budget depends less on page count than on custom features, integrations, and testing across devices.
I’m Joseph Riviello, founder and CEO of Zen Agency, with over 22 years of experience connecting website and marketing decisions to leads and revenue. I’ll use that perspective to explain responsive web design cost, including what a quote should cover and where long-term costs can hide.
Glossary for responsive web design cost:
Responsive Web Design Cost Breakdown by Project Type in 2026
When evaluating estimates, it helps to understand that web design pricing is driven by functional complexity, custom integrations, design fidelity, and cross-device testing requirements. A project with five intricate interactive calculators will often demand a higher budget than a 50-page static marketing site.
When understanding website design cost and budgeting effectively, reviewing standard project tiers provides a clear baseline:
| Project Tier | Scope & Features | Timeline | Upfront Build Cost Range | Typical Annual Maintenance |
|---|---|---|---|---|
| Simple Brochure | 5–15 pages, pre-built design systems, contact forms, standard device testing | 4–8 weeks | $15,000 – $40,000 | $1,500 – $4,000 |
| Mid-Market / Corporate | 15–50 pages, custom UX/UI, CRM integrations, interactive components, performance budgets | 8–16 weeks | $40,000 – $100,000 | $5,000 – $15,000 |
| E-Commerce Store | Complex filtering, multi-step checkout, payment gateways, product variations | 12–20 weeks | $11,000 – $100,000+ | $8,000 – $25,000+ |
| Enterprise Portal | 50+ custom templates, ERP/API integrations, role-based access, automated CI/CD device testing | 16–32+ weeks | $100,000 – $350,000+ | $25,000 – $60,000+ |
Standard Brochure and Small Business Websites
For local service businesses or early-stage brands, a brochure site primarily focuses on brand credibility, basic service showcases, and lead capture. When examining what a simple website design cost includes, the work generally centers on responsive layout structuring, brand-aligned styling, standard contact form routing, and baseline browser testing across primary screen sizes.
At this level, custom responsive styling ensures typography scales dynamically and navigation menus collapse cleanly into accessible mobile patterns. Because these projects typically rely on established component libraries rather than custom micro-interactions, turnaround times usually remain between 4 to 8 weeks.
Estimating Responsive Web Design Cost for E-Commerce and Enterprise Portals
As your operational complexity grows, so does the development rigor required to deliver a seamless responsive experience. Modern online stores and enterprise hubs require responsive architecture that dynamically adapts dense data sets into intuitive mobile touch interfaces.
Key technical factors affecting these larger investments include:
- E-Commerce Checkout & Filtering: Mobile shoppers demand frictionless one-thumb checkout experiences, persistent sticky carts, and off-canvas facet filtering.
- Enterprise Integrations: Connecting responsive front-ends to custom ERPs, legacy CRMs, and complex inventory systems requires structured state management that does not compromise mobile load speeds.
- Custom Design Architectures: Navigating custom website design pricing factors involves balancing bespoke front-end experiences against long-term maintenance needs. According to real mobile-first build pricing benchmarks, sophisticated UI flows demand higher initial engineering, but they safeguard performance across complex user journeys.
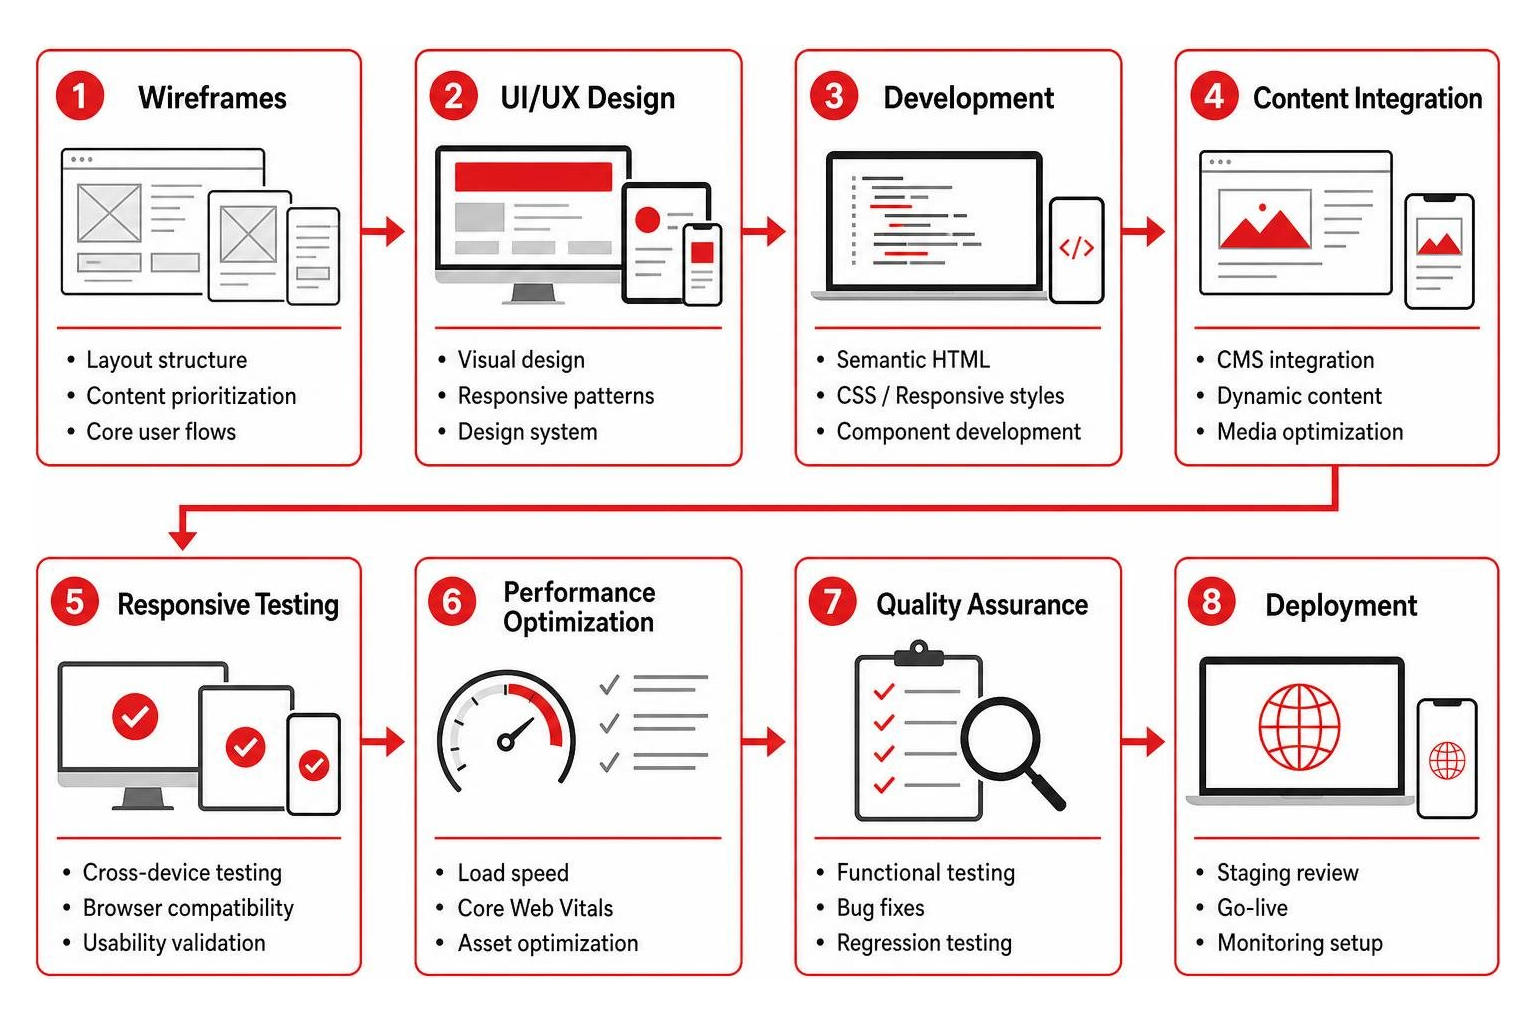
Mobile-First vs. Desktop-First: Upfront Pricing vs. Long-Term TCO
With mobile devices consistently accounting for 65% to 72% of global web traffic, how your engineering team approaches screen responsiveness directly shapes your balance sheet. The three primary methods for handling multi-device support involve distinctly different cost structures:
| Architecture Approach | How It Works | Upfront Cost Variance | 3-Year Total Cost of Ownership (TCO) | SEO & Core Web Vitals Impact |
|---|---|---|---|---|
| Mobile-First Responsive | Styles are coded for mobile viewports first, then scaled up via media queries. Single codebase. | 5%–10% higher upfront vs. legacy desktop | Lowest (Saves 8%–15% overall) | Optimal; passes Google Mobile-First Indexing and Core Web Vitals out of the box. |
| Mobile-Adaptive (Retrofit) | Desktop site built first; media queries override desktop styles for smaller screens. Single codebase. | Baseline upfront | Moderate to High (Requires 20%–40% retrofit premium within 18–24 months) | Sub-optimal; often carries bloat, leading to slower Interaction to Next Paint (INP) and Largest Contentful Paint (LCP). |
| Separate Mobile Site (m.dot) | Completely distinct mobile site and desktop site operating on separate subdomains. | 80%–150% higher upfront | Highest (Double maintenance, separate hosting, dual bug fixes) | High risk of split URL indexing, duplicate content issues, and canonical tag errors. |
Understanding why responsive website design matters is essential when planning your infrastructure. Retrofitting a non-responsive or desktop-first site down the road costs 2 to 4 times more than building mobile-first from day one. For a typical 30-page site, a later mobile retrofit can run between $3,000 and $15,000, compared to a modest $800 to $2,500 incremental cost when engineered properly at launch.
Upfront Investment vs. Total Cost of Ownership
While a mobile-first build can cost 5% to 10% more during initial design and layout development, it saves 8% to 15% on total cost of ownership across the life of the platform. Starting with the constraints of smaller viewports eliminates non-essential code early, resulting in 40% to 60% less feature creep during production.
Furthermore, desktop-first websites often require significant redesigns every 18 to 30 months as mobile traffic patterns shift and performance lags. In contrast, well-structured mobile-first builds—such as enterprise-grade responsive WordPress development—easily stay performant and relevant for 3 to 5 years. The break-even period for the slightly higher upfront mobile-first investment is typically reached within 8 to 14 months.
Advanced Responsive Features: When Are They Worth the Cost?
Deciding when to invest in advanced responsive capabilities comes down to evaluating user engagement against engineering overhead:
- Dynamic Viewport Personalization ($2,500 – $8,000): Tailoring module density and navigation structures dynamically based on device orientation and screen constraints.
- Complex Interactive Components ($3,000 – $12,000): Engineering touch-optimized data grids, interactive product visualizers, and sticky action panels that maintain 60fps rendering across viewports.
- Performance Trade-Offs: Each dynamic feature must be balanced against mobile payload size. Sophisticated micro-interactions add polish, but over-engineering non-critical elements can degrade Core Web Vitals and inflate ongoing QA costs.
Key Levers and Hidden Factors That Drive Your Development Budget

Understanding the technical mechanisms behind your quote prevents surprises. Incorporating modern website design best practices requires balancing performance standards against rich visual functionality.
The 7 Architecture Levers Driving Responsive Web Design Cost
- Performance Budget Rigor: Requiring a sub-1.5s mobile Largest Contentful Paint (LCP) adds 15% to 25% to front-end development costs compared to a standard 2.5s baseline because it requires custom asset loading, critical CSS inlining, and aggressive script tree-shaking.
- Custom Touch Gestures & Micro-Interactions: Swiping carousels, bottom sheets, pinch-to-zoom galleries, and pull-to-refresh patterns require custom touch event handlers and testing across varied operating systems ($1,800 to $5,000+).
- Mobile-Specific Features: Native integration with device capabilities like click-to-call, camera uploads, or geolocation routing adds engineering time.
- Adaptive Image & Media Optimization: Serving different image resolutions and modern WebP/AVIF formats based on client viewport breakpoints requires programmatic image generation. When optimizing imagery for responsive layouts, automated pipelines prevent visual degradation and bloat.
- Testing Matrix Scope: Testing across 3 standard devices is often bundled into basic proposals, but expanding validation to a 10+ hardware matrix (covering varied screen aspect ratios, foldables, and budget Android devices) adds $1,500 to $8,000 in dedicated QA hours.
- WCAG 2.5.5 Touch Target Compliance: Designing touch targets to meet strict accessibility standards (minimum 44×44 or 48×48 CSS pixels) requires thoughtful spatial layout planning across compact mobile screens.
- Offline Capability & Service Workers: Configuring caching strategies and offline fallbacks requires structured front-end architecture.
Uncovering Hidden and Ongoing Mobile Maintenance Expenses
Beyond initial development, responsive sites carry operational expenses that frequently catch stakeholders off-guard:
- Cloud Device Testing Platforms: Subscriptions to real-device testing farms (e.g., BrowserStack) cost $400 to $3,000 annually.
- Mobile Web Font Licensing: Tiered font licenses based on pageview thresholds can add $500 to $4,000 annually.
- Image CDN & Edge Bandwidth: Delivering responsive media assets via global CDNs incurs dynamic traffic costs of $600 to $3,600+ yearly.
- Push Notification Infrastructure: Managing subscriber endpoints and background push notifications costs $300 to $2,400 per year.
- Mobile Telemetry & Session Recording: Mobile heatmaps and interaction tracking add $500 to $3,000 annually.
- Accessibility & Compliance Audits: Regular audits to maintain WCAG mobile compliance run $2,000 to $10,000 per year.
In total, unbudgeted mobile-related services can add $5,000 to $25,000 per year across hosting, tooling, and infrastructure.
Strategic Execution: Vendor Selection, Cost Reduction, and Business ROI
Selecting the right partner model determines whether your project launches on schedule or encounters costly technical roadblocks. Our complete website design and development guide highlights how different execution models balance cost against operational risk:
| Vendor Model | Hourly Rate Range | Project Cost (Corporate Site) | Accountability & Risk Profile |
|---|---|---|---|
| Freelancer | $25 – $85 / hr | $5,000 – $25,000 | High Risk: Single point of failure; variable QA, testing hardware, and ongoing support. |
| Professional Digital Agency | $150 – $350+ / hr | $40,000 – $150,000+ | Low Risk: Comprehensive UX, engineering, QA, strategy, and dedicated project management. |
How to Cut Development Costs by 30% to 50% Without Sacrificing Quality
You can substantially decrease project spend while maintaining high performance and code quality by adopting several proven strategies:
- Adopt a Mobile-First Utility Framework: Using frameworks like Tailwind CSS or modern Bootstrap eliminates thousands of lines of redundant, overriding CSS, cutting front-end layout time by 20% to 30%.
- Use System Font Stacks: Relying on native operating system fonts (San Francisco on iOS, Roboto on Android, Segoe UI on Windows) eliminates font file downloads, saves hundreds in licensing fees, and improves mobile rendering speeds.
- Leverage Edge Media Optimization: Using integrated CDN transformation services (such as Cloudflare Image Optimization) automates responsive asset generation without requiring expensive custom server-side resizing scripts.
- Establish a Focused Device Matrix: Focus real-hardware testing on the top 5 to 7 devices that represent 85%+ of your specific user base, relying on automated browser engines for long-tail validation.
- Use Native HTML5 Form Inputs: Implementing native mobile inputs (such as
type="tel"ortype="email") triggers correct mobile keyboards without relying on heavy third-party JavaScript libraries. - Phase Non-Critical Micro-Interactions: Launch Phase 1 with clean, accessible static layouts, deferring complex swipe interactions and dynamic animations to subsequent iterations based on user behavioral data.
Quantifying the Business ROI of a Responsive Redesign

Investing in a responsive, mobile-first build generates clear commercial returns:
- Conversion Rate Lift: Companies that upgrade to a custom responsive architecture experience an average 15% to 20% increase in mobile conversion rates within the first 12 months. Published benchmarks show mobile-first sites outperform retrofitted desktop sites by 12% to 25% on mobile checkout completions.
- Speed-Driven Revenue Gains: A 1-second improvement in mobile Largest Contentful Paint (LCP) directly produces a 5% to 12% lift in mobile conversions.
- Reduced Bounce Rates: Non-responsive or poorly adapted mobile sites suffer 10% to 30% higher mobile bounce rates compared to optimized responsive layouts.
- Organic Search Growth: Because Google strictly uses mobile-first indexing, sites launching with clean mobile architectures rank 8% to 15% higher in mobile search results within 6 to 9 months compared to desktop-retrofitted alternatives.
- Maintenance Consolidation: Maintaining a single responsive codebase reduces ongoing feature development and QA overhead by 30% to 50% compared to dual-codebase setups.
Frequently Asked Questions About Mobile-Ready Builds
Is mobile-first responsive design more expensive than a traditional desktop-first build?
Upfront development for a mobile-first site costs roughly 5% to 10% more due to initial mobile UX planning and responsive grid architecture. However, it delivers an 8% to 15% reduction in total cost of ownership across 3 years by completely eliminating the need for expensive mobile retrofit projects, which typically cost 2 to 4 times more than building mobile-first from day one.
How much does responsive testing on real mobile devices add to the budget?
Standard responsive testing covering 2 to 3 baseline viewport sizes is typically included in base project scopes. Expanding QA to a comprehensive physical device matrix (10+ real iOS and Android devices, tablets, and differing aspect ratios) typically adds between $1,500 and $8,000 depending on the depth of user flows and transactional paths.
How can responsive design improve the mobile experience cost-effectively?
The most cost-effective responsive builds prioritize content hierarchy, performance budgets, and native browser capabilities over complex custom scripts. Utilizing modern utility-first CSS frameworks, native form inputs, and system typography delivers an app-like mobile experience without inflating development and ongoing maintenance budgets.
Conclusion
Understanding your true investment in responsive web design requires looking beyond upfront development hours to evaluate long-term maintenance, performance benchmarks, and user conversion. Prioritizing a mobile-first architecture from day one protects your budget against costly retrofits, optimizes Core Web Vitals, and captures the greatest share of modern search traffic.
Since 2008, Zen Agency has partnered with growing businesses to deliver high-performance, enterprise-grade digital platforms. Whether you need a strategic corporate overhaul or an integrated commerce platform, our team builds scalable digital experiences tailored to your business goals. Explore our custom enterprise responsive web design services to start planning your build today.