Simple Tweaks That Instantly Lift Shopify Store Sales
Simple Shopify Conversion Tweaks That Turn More Visits Into Sales
Start Shopify conversion rate optimization by fixing the places where buyers hesitate most: product pages, mobile browsing, carts, and checkout. Focus on these high-impact improvements first:
- Make product pages easier to trust with clear benefits, strong images, visible reviews, and shipping and return details near the Add to Cart button.
- Improve mobile speed and usability. Mobile drives most ecommerce traffic, but it converts below desktop on average.
- Remove checkout surprises by showing total costs early, allowing guest checkout, and enabling fast payment options such as Shop Pay.
- Track where shoppers leave the funnel before changing your theme, spending more on ads, or adding more apps.
The average Shopify store converts about 1.4% of sessions. A store above 3.2% is ahead of roughly 80% of Shopify stores, but the right target depends on your product category, traffic quality, device mix, price point, and returning-customer share. The goal is not to chase a single benchmark. It is to make every qualified visit more likely to become a profitable order.
I am Joseph Riviello, CEO and Founder of Zen Agency, with more than 22 years of experience helping companies improve traffic, leads, conversions, and revenue through full-funnel digital strategy. In this guide, I will break down Shopify conversion rate optimization into practical fixes you can prioritize, measure, and improve over time.

Essential shopify conversion rate optimization terms:
Mastering Shopify Conversion Rate Optimization: Benchmarks and Funnel Realities
Before spending money on aggressive ad campaigns, every merchant must master the foundational mathematics of their store. Conversion rate optimization (CRO) is not a collection of arbitrary cosmetic changes. It is an iterative, diagnostic process that evaluates how visitors move from initial landing through final checkout.
To establish your baseline evaluation, use the standard ecommerce conversion formula:
$$text{Conversion Rate} = left( frac{text{Total Completed Orders}}{text{Total Sessions}} right) times 100$$
A common mistake is evaluating site-wide numbers in isolation. If your store records 10,000 sessions and generates 140 orders in a 30-day window, your site-wide conversion rate is 1.4%. However, that top-line number masks where leaks actually occur.
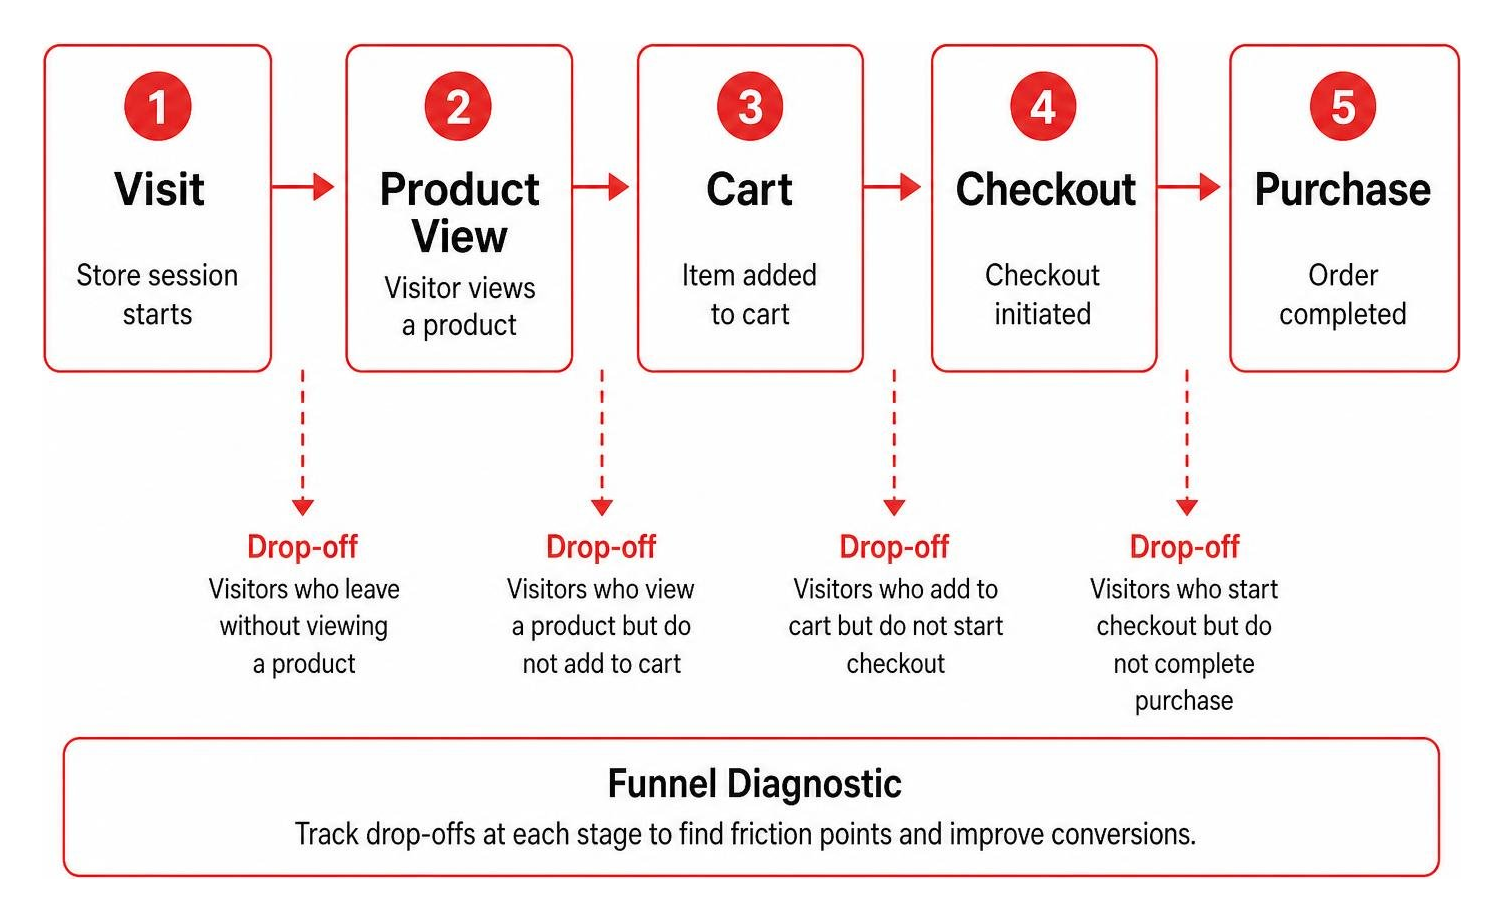
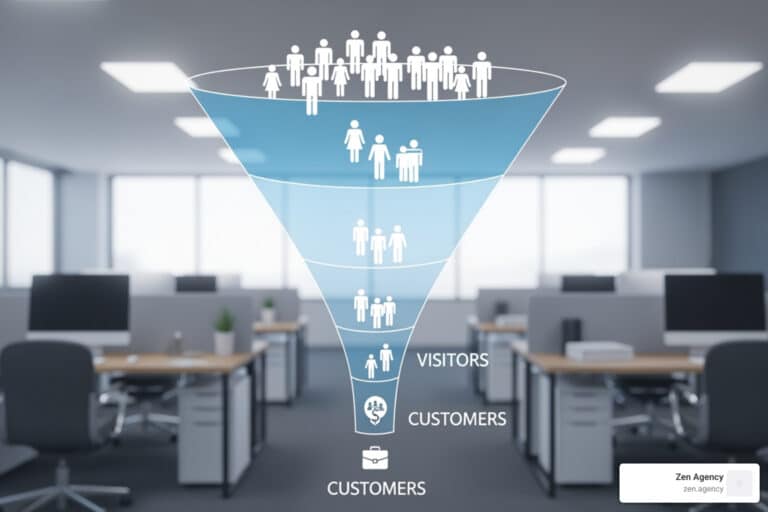
A comprehensive funnel analysis tracks performance across four distinct micro-conversion milestones:
- Product Page Views: The percentage of landing sessions that explore a specific product.
- Add-to-Cart (ATC) Rate: The percentage of product-viewing visitors who click add-to-cart (industry median hovers around 8–12%).
- Cart-to-Checkout Rate: The proportion of cart holders who initiate the checkout process.
- Checkout Completion Rate: The share of initiated checkouts that result in a paid transaction.
Understanding where friction originates is crucial. As we explore in The Ultimate Guide to Improving Your Conversion Rate, isolating the exact point of customer hesitation allows you to deploy targeted design and copywriting fixes rather than guessing. Reviewing the official Shopify conversion rate optimization guide reinforces that systematic, full-funnel diagnostics always outperform reactive storefront redesigns.
Industry Benchmarks and Device Disparities
A baseline conversion rate of 1.4% represents the average Shopify store performance. Pushing your conversion past 3.2% places your brand ahead of 80% of stores, while achieving 4.7% or higher elevates your storefront into the elite top 10%.
Contextual industry factors dictate realistic performance targets. High-frequency consumer products naturally convert at higher rates than high-consideration luxury items:
| Industry Vertical | Average Desktop CR | Average Mobile CR | Blended Category Median |
|---|---|---|---|
| Food & Beverage | 6.8% | 4.9% | 6.2% |
| Beauty & Personal Care | 5.4% | 3.8% | 4.9% |
| Multi-brand Retail | 5.2% | 3.7% | 4.9% |
| Consumer Goods | 3.4% | 2.1% | 2.8% |
| Apparel & Fashion | 2.2% | 1.4% | 1.8% |
| Home & Furniture | 1.8% | 1.1% | 1.4% |
| Luxury Goods & Jewelry | 1.2% | 0.7% | 0.9% |
Device disparities represent one of the largest revenue leaks in modern ecommerce. Over 70% of ecommerce traffic originates on smartphones, yet mobile conversion rates average just 1.2% globally, compared to 1.9% on desktop. The top 10% of Shopify merchants close this gap by engineering mobile experiences that convert at 3.9% or higher, while their desktop experiences convert at 6.5%+.
Calculating True Conversion Rates and Tracking Segment Data
Evaluating your store using only total users rather than total sessions distorts your data. A single user might visit your store three times across two devices before placing an order. Measuring sessions accounts for changing buyer intent across multiple touchpoints.
To make informed optimization choices, segment your Shopify Analytics and GA4 data by:
- Traffic Channel: Direct and organic search visits almost always convert higher than cold traffic from paid social ads (Meta, TikTok).
- New vs. Returning Visitors: Returning visitors regularly convert at 2x to 3x the rate of first-time visitors because brand familiarity reduces cognitive friction.
- Device Category: Separate iOS, Android, tablet, and desktop metrics to identify browser-specific rendering bugs.
Applying the insights from Conversion Rate Optimisation 101: How to Turn Lurkers into Buyers helps identify low-intent traffic versus on-page UX friction. If your desktop conversion is 3.5% but your mobile rate is 0.6%, your marketing is delivering the right audience, but your mobile theme is actively driving them away.
High-Impact Product Page Adjustments That Drive Add-to-Cart Actions
Approximately 89% of visitors leave product detail pages (PDPs) without clicking Add to Cart. The product page carries the burden of building trust, answering technical questions, proving value, and overcoming purchase anxiety in seconds.

To lift micro-conversions at this stage, follow the strategies outlined in The Ultimate Playbook to Skyrocket Ecommerce Conversion Rates. Ensure every essential buying decision element is visible above the fold on both mobile and desktop screens.
Benefit-Led Copywriting and Visual Hierarchy
Merchants often make the mistake of writing product descriptions that read like raw spec sheets. While dimensions, materials, and ingredients are necessary, they do not trigger emotional buying intent.
Structure your copy to lead with concrete outcomes:
- Lead with the Transformation: Explain what the product does for the customer within the first two sentences.
- Use Bulleted Feature-Benefit Pairs: Instead of listing “500mAh Battery,” write “500mAh Battery — Enjoy up to 18 hours of continuous playback on a single charge.”
- Clutter-Free Visual Hierarchy: Remove distracting sidebars, unnecessary tabs, and low-contrast text blocks. Understanding why minimalist design works ensures your product photography and value propositions remain the primary focal points.
Support your messaging with rich media:
- Provide 5 to 8 high-resolution photos displaying the product from multiple angles, in lifestyle contexts, and in scale reference shots.
- Integrate high-definition video demonstrations or 3D interactive models.
- Implement smooth pinch-to-zoom capabilities so shoppers can inspect textures and fine details.
Strategic Social Proof and Dynamic Trust Badges
Online reviews carry significant weight in consumer decisions; up to 98% of shoppers consult customer feedback before completing a purchase. Products with visible, verified customer reviews convert up to 160% higher than products without social proof.
Maximize credibility on your PDPs by applying these tactics:
- Placement: Place your aggregate star rating and total review count directly underneath the product title, above the price.
- Visual UGC: Feature user-generated photos and videos within the review section. Authentic customer snapshots reduce skepticism about product quality.
- Contextual Guarantees: Place dynamic trust badges near the main CTA button. Explicitly state “30-Day Money-Back Guarantee,” “Hassle-Free Returns,” and “Ships within 24 Hours.”
- Review Moderation Transparency: Do not hide reasonable 3-star and 4-star reviews. A flawless 5.0 rating across hundreds of reviews often triggers suspicion; authentic customer feedback builds genuine buyer confidence.
Eliminating Friction in Cart and Checkout Flows
Nearly 70% of all ecommerce carts are abandoned before payment is completed. Abandonment rarely happens without a clear reason; it typically stems from unexpected fees, forced account creation, clunky forms, or payment hesitation.
Studying The Best Checkout Page Designs: A Guide to Frictionless Shopping illustrates that reducing friction across the final checkout steps directly recovers lost revenue.
Streamlining Checkout with Accelerated Wallets and Shop Pay
Shopify provides one of the highest-converting checkout architectures in the industry. Integrating accelerated wallet solutions significantly speeds up the transaction process.

Shop Pay increases checkout conversion rates by up to 50% compared to traditional guest checkouts. One-click wallets store shipping addresses, billing details, and payment preferences across the global network of Shopify stores, eliminating manual data entry.
- Express Payment Priority: Surface Shop Pay, Apple Pay, Google Pay, and PayPal at the very top of your checkout and cart drawer.
- Guest Checkout as Default: Never force a first-time visitor to create an account with a password before buying. Offer frictionless guest checkout, then provide an optional account creation prompt on the post-purchase “Thank You” page.
- Single-Column Form Layouts: Keep address and payment forms in a single vertical column with browser autofill enabled. This layout reduces visual complexity and prevents form errors on mobile devices.
Transparent Costs and Reducing Cart Abandonment
Unexpected shipping fees and hidden taxes at the final step are the primary drivers of checkout abandonment. Eliminate these drop-offs by practicing full fee transparency:
- Dynamic Free Shipping Progress Bars: Implement an interactive progress bar inside your slide-out cart drawer (e.g., “Add $14.00 more to unlock Free Standard Shipping!”). This tactic reduces abandonment while actively lifting your Average Order Value (AOV).
- Early Delivery Estimates: Display anticipated delivery date ranges directly on the product and cart pages based on the user’s general geolocation.
- Slide-Out Ajax Cart Drawer: Use a responsive slide-out cart drawer rather than redirecting shoppers to a separate cart page. This keeps visitors in their browsing flow while clearly summarizing line-item costs, taxes, and shipping eligibility.
- Automated Abandonment Recovery: Configure a multi-stage abandoned cart sequence (combining email and SMS) triggering at 1 hour, 24 hours, and 48 hours post-abandonment, addressing common objections rather than immediately discounting.
Technical Performance and Mobile-First Architecture
A visually appealing store cannot convert visitors if it loads slowly. Technical performance directly impacts consumer behavior: a single-second delay in page load time can reduce overall conversion rates by up to 7%. Furthermore, over 53% of mobile visitors abandon a page entirely if it takes longer than 3 seconds to render.
Incorporating modern CRO Best Practices requires treating site speed not as an isolated IT task, but as a core pillar of your sales strategy.
Core Web Vitals and Lightweight Theme Execution
Google’s Core Web Vitals measure real-world user experience across loading speed, interactivity, and visual stability:
- Largest Contentful Paint (LCP): The time it takes for the primary content block (usually the hero image or headline) to render. Target an LCP of under 2.5 seconds on mobile connections.
- Interaction to Next Paint (INP): Measures page responsiveness to user inputs like taps or clicks. Target an INP below 200 milliseconds.
- Cumulative Layout Shift (CLS): Measures unexpected layout shifting during page load. Maintain a CLS score under 0.1.
To maintain these technical benchmarks:
- Adopt Lightweight Themes: Build upon optimized, OS 2.0-compliant themes (such as Dawn or cleanly coded custom themes) rather than legacy themes loaded with unused styling frameworks.
- Audit App Scripts: Regularly audit third-party tracking scripts, chat widgets, and abandoned marketing plugins. Use tools like Google Tag Manager to defer non-essential scripts until after the primary page content finishes rendering.
- Automate Image Compression: Serve modern image formats like WebP or AVIF, define explicit image dimension tags to eliminate layout shift, and use native lazy-loading for media below the fold.
Mobile UX Tweaks: Sticky CTAs and Thumb-Zone Design
Because smartphone screens provide limited viewing area, desktop layouts cannot simply be shrunk down for mobile users. A mobile-first shopping experience demands interface elements engineered around natural hand ergonomics.
- 44px Minimum Tap Targets: Ensure every clickable button, navigation link, dropdown, and variant selector has an active tap target of at least 44×44 pixels to prevent accidental clicks.
- Sticky Add-to-Cart Bar: Implement a fixed, sticky Add-to-Cart bar that anchors to the bottom of the mobile viewport once the user scrolls past the primary hero buy box. This keeps the purchase action easily accessible without requiring users to scroll back up.
- Thumb-Zone Navigation: Place essential UI controls—including search buttons, category filters, and checkout buttons—within the natural sweep of the user’s thumb in the lower half of the display.
Prioritization, Testing, and Continuous CRO Execution
Conversion rate optimization is an ongoing discipline, not a one-time project. High-performing Shopify merchants run systematic experimentation cycles to ensure every design change produces a verifiable lift in revenue.
Merchants looking to formalize their internal optimization roadmap can reference the structured modules found in the Conversion Rate Optimization with Shopify curriculum, which emphasizes data-driven audits prior to tactical implementation.
Step-by-Step Framework for Shopify Conversion Rate Optimization
To avoid testing minor elements that have negligible impact on your bottom line, prioritize ideas using the PIE Framework:
- Potential: How much improvement is possible on this specific page? (e.g., A PDP with an 89% bounce rate offers far more potential than a checkout page that already converts at 80%).
- Importance: How valuable is the traffic visiting this page? (e.g., High-volume collection and product pages outweigh a policy page).
- Ease: How technically difficult and resource-intensive is this test to implement?
Score each criterion from 1 to 10, calculate the average, and sort your backlog by the highest total score.
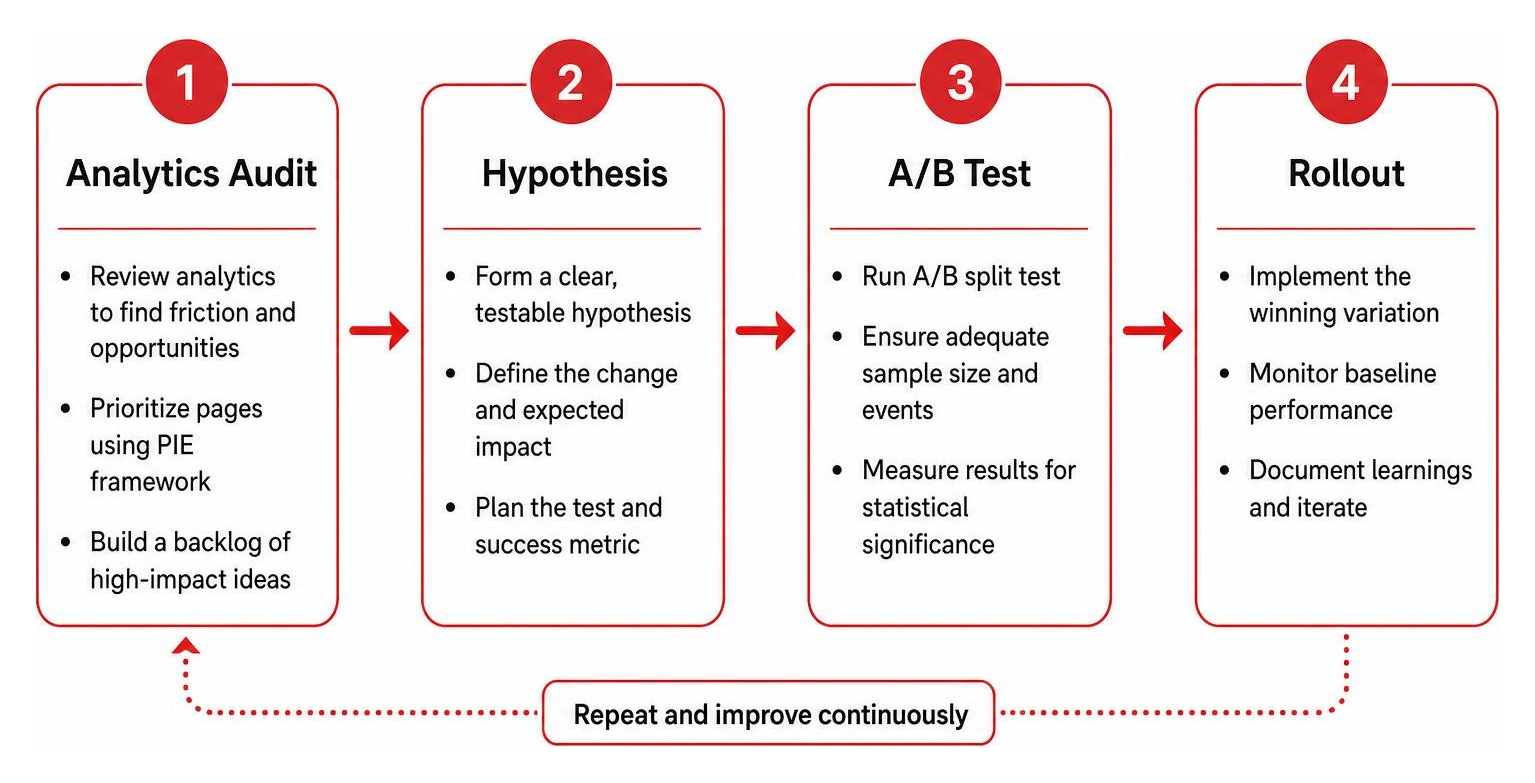
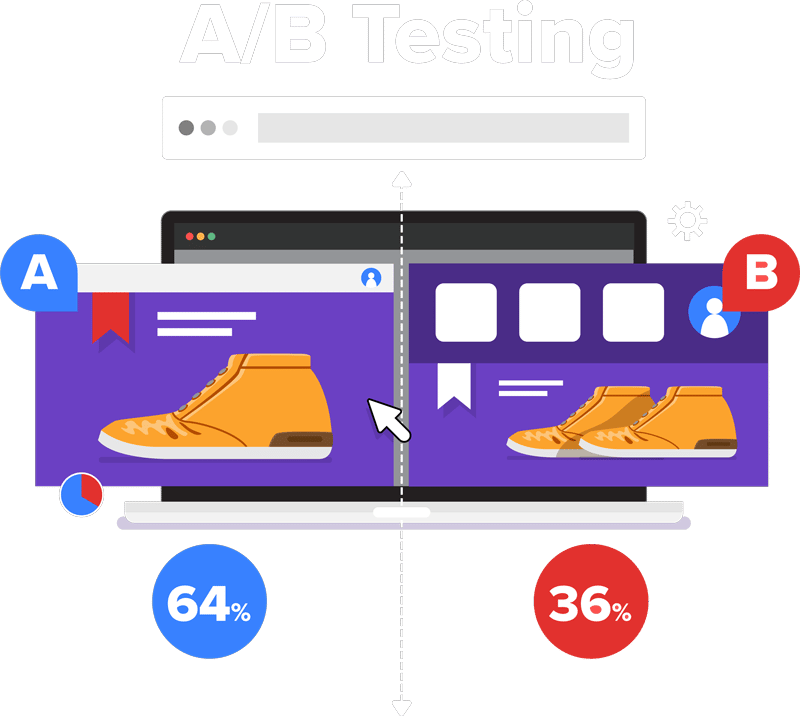
Before launching an A/B split test, verify your sample sizes. Reliable statistical significance generally requires at least 50,000 monthly sessions per page template alongside several hundred conversion events. If your store generates lower volume, rely on qualitative feedback—such as session recordings, user heatmaps, and on-site exit surveys—to identify obvious UI roadblocks, implement improvements directly, and monitor the resulting baseline trend.
Essential Tools for Shopify Conversion Rate Optimization in 2026
Building an effective CRO stack involves pairing quantitative performance data with qualitative behavioral insights:
- Behavioral Analytics & Heatmaps: Tools like Hotjar, Microsoft Clarity, and Lucky Orange reveal where users click, where they hesitate, and how far down PDPs they scroll before bouncing.
- Customer Reviews & Social Proof Platforms: Solutions like Yotpo and Okendo streamline photo and video UGC collection, while structuring rich snippet schema for search engine results.
- Predictive On-Site Search: AI-powered discovery applications provide instant auto-suggestions, handle typos, and surface personalized recommendations as visitors type.
- Unified Attribution & Analytics Layers: Platforms like Triple Whale and Google Analytics 4 help reconcile server-side purchase data against multi-channel ad spend, preventing misleading platform-reported conversion figures.
Frequently Asked Questions About Shopify Conversion Rate Optimization
Why is my Shopify store getting traffic but no sales?
Traffic without sales usually stems from three core issues:
- Audience Mismatch: Your advertising targeting may be attracting low-intent visitors whose expectations do not align with what your landing page delivers.
- Trust Deficits: First-time visitors often leave within seconds if a store lacks verifiable customer reviews, displays broken layout styling, hides basic contact details, or fails to state clear return terms.
- Hidden Fees at Checkout: If visitors add items to their cart but abandon during checkout, unexpected shipping costs or mandatory account creation steps are likely causing the drop-off.
Should I focus on driving traffic or improving conversion rate first?
Prioritize conversion rate fundamentals before scaling ad budgets. Driving high-cost traffic to a store that converts below 1% burns capital on clicks that will not convert.
Once your store consistently converts baseline traffic at 2.0% to 3.0%, scaling your paid ad spend becomes significantly more profitable and predictable.
What is considered a good Shopify conversion rate in 2026?
A 1.4% conversion rate represents the global median across Shopify stores. A conversion rate exceeding 3.2% places your store in the top 20% of merchants, while maintaining a rate above 4.7% puts you in the top 10%.
These benchmarks vary across industries; consumable categories like Food & Beverage frequently achieve 5.0%+ conversion rates, while high-ticket furniture and luxury goods typically convert around 1.0% to 1.5%.
Conclusion
Lifting your Shopify conversion rate does not require an immediate, expensive overhaul of your entire digital presence. By methodically addressing the friction points that cause hesitation—such as mobile usability bugs, uninspired product page copy, absent trust signals, and multi-step checkout hurdles—you can generate meaningful lifts in revenue from the traffic your store already receives.
Conversion rate optimization delivers compounding returns. A series of incremental improvements—a 10% lift in product page engagement, an 8% reduction in cart abandonment, and a 12% boost in checkout completion—can collectively transform your store’s overall profitability.
At Zen Agency, our digital marketing and web development specialists build high-performing ecommerce experiences that turn casual browsers into loyal customers. If you are balancing paid acquisition across multiple channels, exploring e-commerce vs service-based PPC campaigns can help you align your traffic strategies with on-page conversion goals. Start by auditing your sales funnel today, systematically eliminate friction, and build a dependable foundation for scalable ecommerce growth.