How to Budget for Social Media Ads Without Breaking the Bank
How to Budget for Social Media Ads Without Wasting Spend
Social media ads cost can range from a few dollars a day to thousands per month, but the right budget depends on your goal, margin, and platform. As a practical starting point, test one platform with $5 to $20 per day for simple awareness or traffic campaigns, or budget $300 to $500 per month when you need enough data to evaluate results.
In 2026, lower-cost reach is often available on Pinterest, TikTok, and YouTube. Meta can be a strong option for ecommerce and retargeting, while LinkedIn usually costs more per click but may deliver better-qualified B2B leads. The cheapest click is not always the most profitable customer.
Before setting a budget, know your target cost per lead or sale. Then include more than ad spend: creative, landing pages, tracking, and campaign management can all affect your real return on ad spend.
I’m Joseph Riviello, CEO and Founder of Zen Agency, with more than 22 years of experience helping companies improve visibility, leads, conversions, and revenue. I use a full-funnel view of social media ads cost, so budgets are tied to profitable business outcomes rather than vanity metrics.

Learn more about social media ads cost:
Breaking Down Social Media Ads Cost by Platform in 2026
Every social platform uses an automated auction system to sell ad inventory, but the final bill varies wildly depending on user demographics, ad format, and competition. When we evaluate paid social pricing, we look primarily at Cost Per Mille (CPM, or the cost per 1,000 impressions) and Cost Per Click (CPC).
To give you an honest baseline, here is how the primary networks stack up in 2026 based on comprehensive social media advertising benchmarks:
| Platform | Average CPM (2026) | Average CPC (2026) | Typical Minimum Daily/Campaign Budget | Primary Strength |
|---|---|---|---|---|
| Meta (FB & IG) | $8.00 – $14.00 | $0.40 – $1.75 | $1 – $5 / day | Full-funnel ecommerce, retargeting |
| TikTok | $4.00 – $9.00 | $0.20 – $1.00 | $20 / ad group ($50 / campaign) | Gen Z / Millennial discovery, viral video |
| $6.50 – $35.00+ | $5.00 – $12.00+ | $10 / day | High-ticket B2B, precise professional targeting | |
| YouTube | $4.00 – $6.00 | $0.10 – $0.30 (CPV) | $10 / day | Intent-driven video, brand storytelling |
| $2.00 – $5.00 | $0.10 – $1.50 | $5 / day | Visual search, high purchase intent | |
| Snapchat | $3.00 – $8.60 | $0.25 – $1.00 | $5 / day | Young mobile audiences, AR filters |
Understanding cross-platform social ad cost research helps prevent overspending on channels that do not fit your immediate commercial goals.
Meta Advertising Costs (Facebook & Instagram)
Meta remains the anchor of most paid social strategies due to its mature machine-learning algorithms and expansive audience scale.
- Facebook: Averages an across-industry CPC of $0.44 to $0.70 for basic link clicks, with CPMs hovering between $8.00 and $14.40. Converting audiences on high-ticket offers can push CPCs past $1.70.
- Instagram: Tends to exhibit slightly higher engagement rates, resulting in average CPCs of $0.20 to $2.00 and CPMs around $6.70 to $9.50.
- Advantage+ Campaigns: Meta’s automated AI campaign setups routinely reduce cost-per-purchase by up to 17% compared to manual targeting by continuously shifting spend toward top-performing placements.
- Reels Arbitrage: Short-form video placements inside Facebook and Instagram Reels currently offer roughly a 26% lower CPC ($1.28) than traditional standard Feeds ($1.72), making vertical video an essential format for budget-conscious brands. Partnering with seasoned Facebook ads management services can help you capitalize on these placement efficiencies.
TikTok Ad Pricing and Entry Budgets
TikTok is a discovery engine where creative execution dictates your pricing.
- In-feed ads feature low barrier entry CPMs ($4.00 to $9.00) and CPCs averaging around $1.00.
- The platform enforces account minimums: $50 per campaign level and $20 per ad group daily.
- Spark Ads: Boosting native creator posts via Spark Ads regularly drives 25% higher watch times and lower effective acquisition costs than standard brand-uploaded video ads.
- TikTok Shop Integration: By removing external browser redirects, in-app checkout delivers significantly higher conversion rates, keeping final acquisition costs manageable despite aggressive ad creative fatigue (TikTok ads typically need refreshing every 7 to 14 days).
LinkedIn Ad Rates for B2B vs. Consumer Channels
LinkedIn is an auction environment tailored specifically for enterprise decision-makers. You will pay a distinct premium:
- Average CPC sits at $5.26 to $12.00+, with CPMs regularly clearing $30.00 for competitive executive audiences.
- Sponsored InMail / Message Ads average roughly $0.80 per send.
- Why pay this premium? LinkedIn lets you filter by job title, company size, revenue tier, and industry seniority. For enterprise B2B sales cycles with five-figure deal values, generating high-intent leads via native Lead Gen Forms justifies the upfront click expense. Review our detailed guide on paid ads for lead generation to structure these high-value funnels properly.
YouTube, Pinterest, and Emerging Ad Placements
- YouTube: Operates on a Cost-Per-View (CPV) pricing model for skippable video ads, averaging between $0.10 and $0.30 per view. Reaching 100,000 engaged viewers typically costs around $2,000, while YouTube Shorts placements provide CPMs as low as $3.00 to $4.00.
- Pinterest: A visual intent engine with CPMs between $2.00 and $5.00 and CPCs from $0.10 to $1.50. It serves as a cost-effective choice for home goods, lifestyle, apparel, and DIY niches.
- Snapchat: Offers low friction entry with $5 daily minimums and CPMs around $3.00 to $8.60. While CPMs grew 47% year-over-year as targeting matured, it remains an affordable testing ground for mobile app installs and younger demographic products.
Key Variables Shaping Paid Social Media Pricing

Platform pricing is never static. The actual rate you pay inside any auction environment fluctuates continuously based on algorithmic calculations and broader supply-and-demand mechanics. Understanding these variables is just as vital as analyzing the cost of PPC advertising in traditional search channels.
What Determines Your Social Media Ads Cost?
Ad auctions do not simply award the top impression to the highest bidder. Platforms calculate a Total Value Score:
$$text{Total Value} = text{Advertiser Bid} + text{Estimated Action Rate} + text{Ad Quality and Relevance}$$
- Ad Quality & Relevance: If your ad earns high Click-Through Rates (CTR) and positive watch times, the platform discounts your effective CPM because your ad keeps users engaged on their app. Weak creative that users skip or hide gets penalized with higher CPMs.
- Audience Specificity: Hyper-targeted custom audiences (e.g., female CFOs in the healthcare sector) face intense bidding competition, raising CPCs. Broader interest or open demographics reduce auction pressure and yield lower costs.
- Campaign Objective: Setting your campaign objective to “Brand Awareness” or “Reach” produces rock-bottom CPMs ($2–$5). Choosing bottom-funnel “Purchase” or “Conversion” objectives triggers advanced machine-learning delivery that costs significantly more per impression ($12–$25+), but delivers users ready to buy.
Seasonality and Peak-Window Price Surges
Auction density peaks whenever massive brand budgets flood the market:

- Q4 Holiday Rush (Black Friday / Cyber Monday): Ad rates spike dramatically across all networks. On Meta, Cyber Monday rates have historically surged to a CPM of $17.70—a 138% increase over baseline annual averages. Across the board, expect standard Q4 CPM increases of 15% to 40%.
- Political Cycles: Major national and regional election cycles flood social ad inventory, driving up general newsfeed pricing across the United States.
- The “Q5” Window: The period immediately following Christmas into early January represents a major arbitrage opportunity. Consumer intent remains high from gift card redemptions, while enterprise holiday ad budgets drop off, causing CPMs to plummet.
Hidden and Overlooked Advertising Expenses
Your media spend (the check you write to Meta, TikTok, or Google) is only one piece of your true marketing expenditure. When building your budget, account for these critical operational line items:
- Creative Asset Production: High-performing vertical videos, photography, and UGC creator licensing fees ($300 to $2,500/month).
- Copywriting & Design Iteration: Continuous variation testing for headlines, hooks, and static graphics.
- Tracking & Attribution Software: Server-side conversion tracking tools (CAPI integrations, specialized multi-touch attribution platforms).
- Landing Page Optimization: Dedicated conversion software, high-speed hosting, and continuous A/B split-testing environments.
How to Build a Realistic Small Business Budget

Jumping straight into paid social without a roadmap is the fastest way to burn through cash. Relying exclusively on organic reach is rarely enough in modern algorithms, as detailed in our analysis of the truth about organic reach. Instead, businesses must implement a phased budget approach.
The 90-Day Budget Ladder and Minimum Spends
To give machine-learning algorithms sufficient conversion signals, ad platforms generally require roughly 50 optimization events per ad set within a 7-day window to exit the initial “Learning Phase.” Spreading $10 a day across five disparate ad sets starves the system of data.
Use this step-by-step framework to scale methodically:
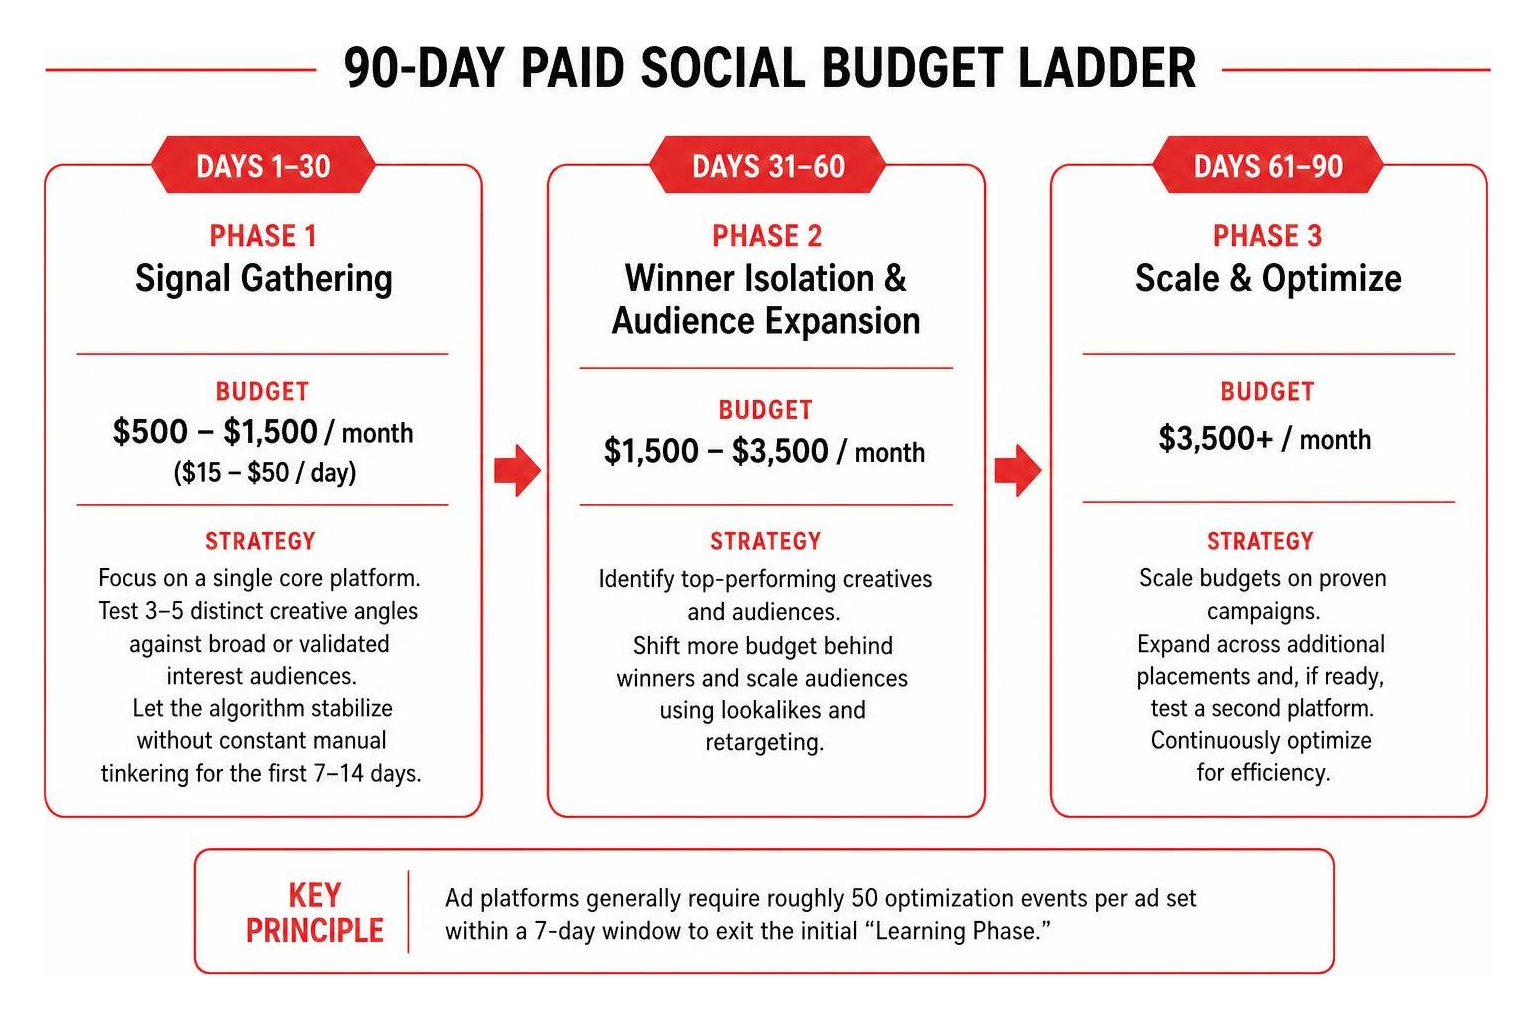
- Phase 1: Signal Gathering (Days 1–30):
- Budget: $500 – $1,500 / month ($15 – $50 / day).
- Strategy: Focus on a single core platform. Test 3–5 distinct creative angles against broad or validated interest audiences. Let the algorithm stabilize without constant manual tinkering for the first 7 to 14 days.
- Phase 2: Winner Isolation & Audience Expansion (Days 31–60):
- Budget: $1,500 – $3,500 / month.
- Strategy: Turn off low-performing creative assets. Funnel 70% of spend into winning hooks and expand lookalike audiences or automated Advantage+ broad targeting. Allocate 30% to dedicated retargeting pools.
- Phase 3: Controlled Scaling & Channel Diversification (Days 61–90+):
- Budget: $3,500 – $10,000+ / month.
- Strategy: Increase budgets by 15–20% every 3 to 4 days to avoid resetting the algorithm’s learning phase. Introduce a secondary channel (such as pairing Meta conversion ads with low-cost TikTok or YouTube top-of-funnel discovery).
Target CPA and Break-Even CAC Framework
Never set your ad budget based on guesswork. Calculate your maximum allowable Cost Per Acquisition (CAC) before spending a single dollar:
$$text{Break-Even CAC} = text{Average Order Value (AOV)} times text{Gross Profit Margin (%)} $$
$$text{Break-Even ROAS} = frac{1}{text{Gross Margin (%)}}$$
Example:
- If your average customer transaction is $100 and your gross profit margin is 60% (0.60):
- Your Break-Even CAC is $60.00. Any customer acquired below $60 yields net profit.
- Your Break-Even Return on Ad Spend (ROAS) is $1.67 ($100 / $60).
- If you aim to acquire 50 customers a month at a target profitable CAC of $40, your required monthly ad spend is simply $2,000 ($40 × 50).
Strategic Playbook to Maximize Campaign ROI
Lowering ad costs is not about “tricking” the auction system—it is about providing better customer experiences and higher-quality assets. When you are ready to scale, partnering with an experienced team through hiring a social media ad agency helps ensure strict budget governance and positive ROAS.
Proven Strategies to Reduce Your Social Media Ads Cost
- Prioritize Native UGC & Lo-Fi Video: Highly polished, corporate-looking video ads often get scrolled past immediately. Authentic, direct-to-camera smartphone footage (user-generated style) consistently drives lower CPMs and higher CTRs across Instagram Reels, TikTok, and YouTube Shorts.
- Consolidate Ad Set Architecture: Splitting small budgets across numerous hyper-niche audiences inflates CPMs. Use broad demographic targeting combined with algorithm-driven placements (such as Meta Advantage+ or TikTok Smart Performance Campaigns) to let platform AI find your ideal buyers at the lowest clearing price.
- Maintain Aggressive Creative Refresh Cycles: Ad fatigue sets in rapidly. When frequency numbers rise above 3.0 on prospecting campaigns, CTR drops and CPMs climb. Introduce new visual hooks and opening 3-second variations every two weeks.
- Eliminate Landing Page Friction: A slow landing page destroys paid ad efficiency. Ensure your post-click destination loads in under two seconds, matches the exact messaging of the ad hook, and features clear trust signals.
A/B Testing and Organic-to-Paid Synergy
Do not pay to test basic messaging hooks. Use your organic channels as a sandbox:
- Publish vertical videos organically across your brand profiles.
- Identify the top 10% of posts that organically generate above-average comments, watch time, and shares.
- Put paid budget behind those proven organic winners as boosted dark posts or Spark Ads.
- Build custom retargeting audiences from users who watched at least 50% of these video assets, serving them direct conversion offers at a fraction of standard cold-prospecting costs.
Frequently Asked Questions About Paid Social Pricing
What is the cheapest social media platform to advertise on in 2026?
For raw impression volume and top-of-funnel visibility, Pinterest and TikTok offer the lowest CPMs, regularly ranging between $2.00 and $5.00 per 1,000 impressions. For direct video views, YouTube Shorts and YouTube In-Stream provide highly affordable Cost-Per-View rates between $0.10 and $0.30. However, impression costs do not always equate to revenue; a $10.00 CPC on LinkedIn may generate a higher net return if it captures a qualified enterprise client compared to a $0.30 click from an unqualified visitor.
How much should a small business spend on social media ads per month?
A practical monthly testing budget for a small business is between $750 and $3,000 per month. This translates to roughly $25 to $100 per day, which provides enough conversion volume for ad network algorithms to exit their initial learning phase. If you are running early-stage awareness campaigns, you can start testing for as little as $5 to $20 per day on a single channel before expanding.
Are social media ad costs rising or falling compared to previous years?
Ad costs continue to experience a modest upward trend, primarily driven by auction saturation and the industry-wide shift toward high-production short-form video inventory. While Meta experienced a slight 1% year-over-year CPM increase through early cycles, platforms with maturing targeting features (like Snapchat) saw CPM increases reaching 27% to 47%. Advertisers who rely on automated AI delivery systems (like Meta Advantage+) and organic-style video creatives can reliably offset these macroeconomic price increases by maintaining higher ad relevance scores.
Conclusion
Managing paid social advertising costs successfully comes down to alignment. When you align your product margins with the right platform, feed the auction algorithms high-converting creative assets, and measure real cost-per-acquisition rather than surface-level metrics, paid social becomes a predictable growth driver rather than a budget drain.
Whether you need to launch your first testing campaign or scale an enterprise media spend across multiple channels, our team at Zen Agency builds customized, ROI-focused strategies tailored to your exact revenue objectives. Weigh your options carefully by evaluating social media marketing vs traditional marketing to make sure your capital is allocated where it drives the greatest return.